Enabling Cross-Site Tracking in GoHighLevel (3rd Party Cookies)
Safari on MacOS Chrome on MacOS Coming Soon Chrome on Windows Coming Soon Firefox on Windows Coming Soon Microsoft Edge on Windows Coming Soon
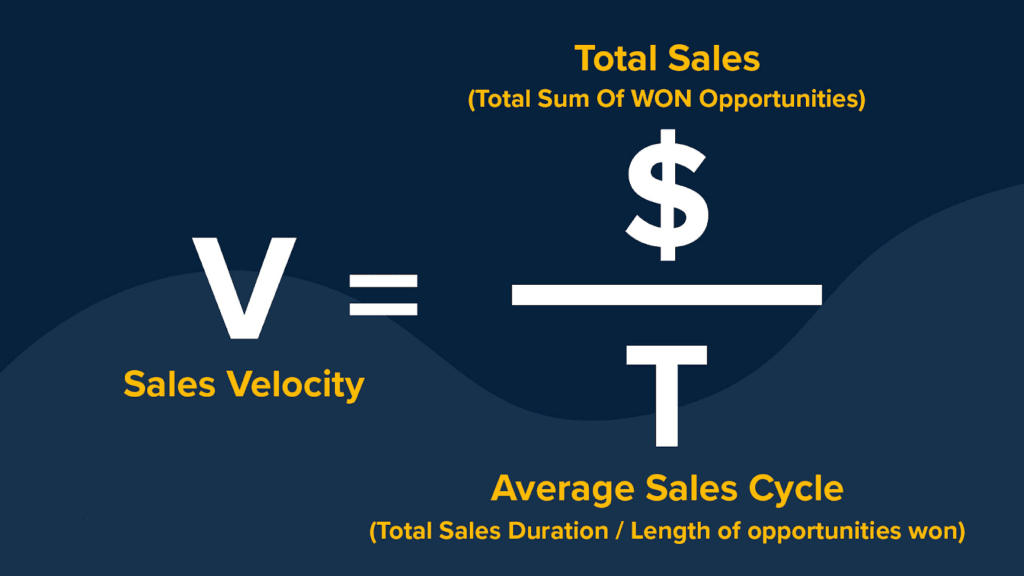
Sales velocity refers to the rate at which opportunities progress from being identified to achieving the “Won” status and generating revenue.

Note: Sales velocity is calculated by dividing the total sales value in USD by the average sales cycle duration in months. The components of the calculation are as follows:
Total Sales Value: The sum of the values of all won opportunities within the selected time range.
Average Sales Cycle:
The average duration it takes for an opportunity to progress from creation to being marked as won.
It is calculated by dividing the total sales duration (the sum of the sales duration of all won opportunities) by the number of won opportunities.
Total Sales Duration: The cumulative duration of all won opportunities, measured in days.
Length of Opportunities Won:
The individual sales duration, which is the difference between the creation time of the opportunity and the time it is marked as won.
In other words, the sales velocity can be expressed as the monthly sales value, represented by the product of the total sales value (V) and the normalized average sales cycle (L). The normalized average sales cycle is calculated in months.
For example, suppose a user has three opportunities marked as won within a one-week time period:
Opportunity #1: Created on December 1st, marked as won on December 20th (open for 20 days), with a sales value of $20.
Opportunity #2: Created on December 15th, marked as won on December 21st (open for 5 days), with a sales value of $40.
Opportunity #3: Created on December 21st, marked as won on December 22nd (open for 2 days), with a sales value of $60.
In this case:
Total Sales Value = $20 + $40 + $60 = $120
Total Sales Duration = 20 days + 5 days + 2 days = 27 days
Average Sales Cycle = 27 days / 3 won opportunities = 9 days
Average Daily Sales Value = $120 / 9 days = $13.33 per day
Monthly Sales Value = ($13.33 per day) * 30 days = $400per month
Therefore, the sales velocity is $400 per month.
