Master the GoHighLevel Dashboard: Metrics, Funnels & Reports
Updated March 2, 2023
Many agency owners log into GoHighLevel without fully understanding what each dashboard component tells them about their business performance. This guide walks you through every default dashboard section — from pipeline opportunities and funnel stages to manual actions and lead source reports.
As soon as you log into the system, your Dashboard will appear, providing an overview of your business’s progress and performance. It encompasses several components, which may include the following by default:
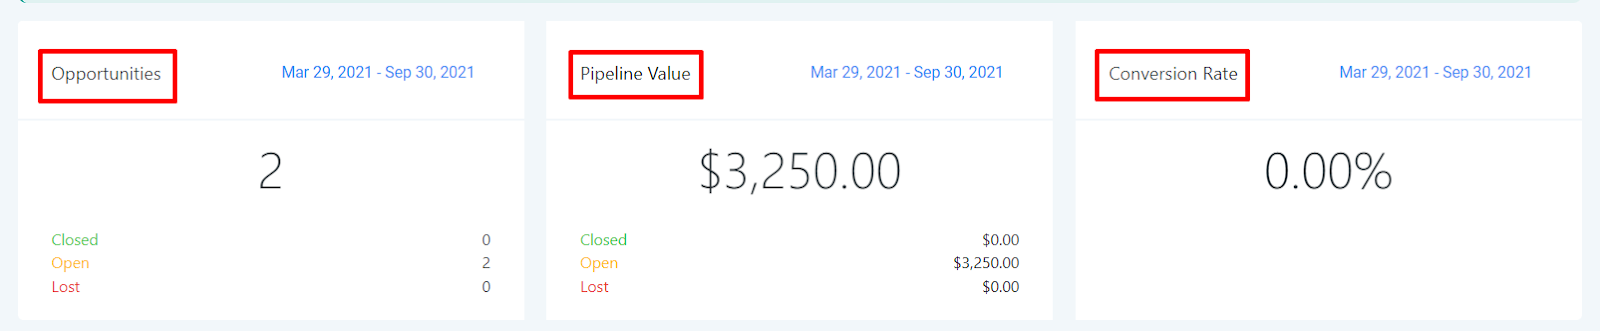
Row 1:
- Opportunities: Number of Leads in your Pipeline
- Pipeline Value: All your leads’ total worth
- Conversion Rate: Percentage of your ‘WON’ leads/accounts
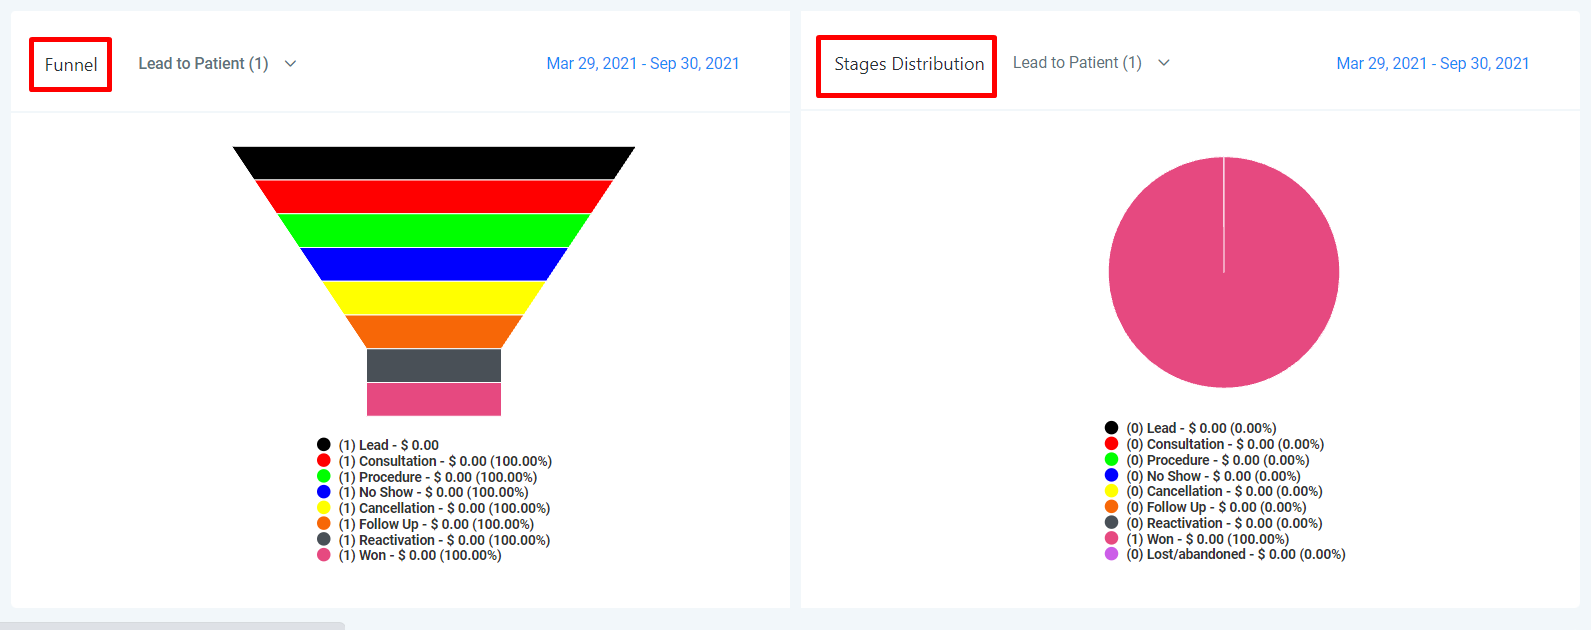
Row 2:
- Funnel: A visual representation of what stages your opportunities are within your Pipeline
- Stages Distribution: This is a cycle graph of your Pipeline
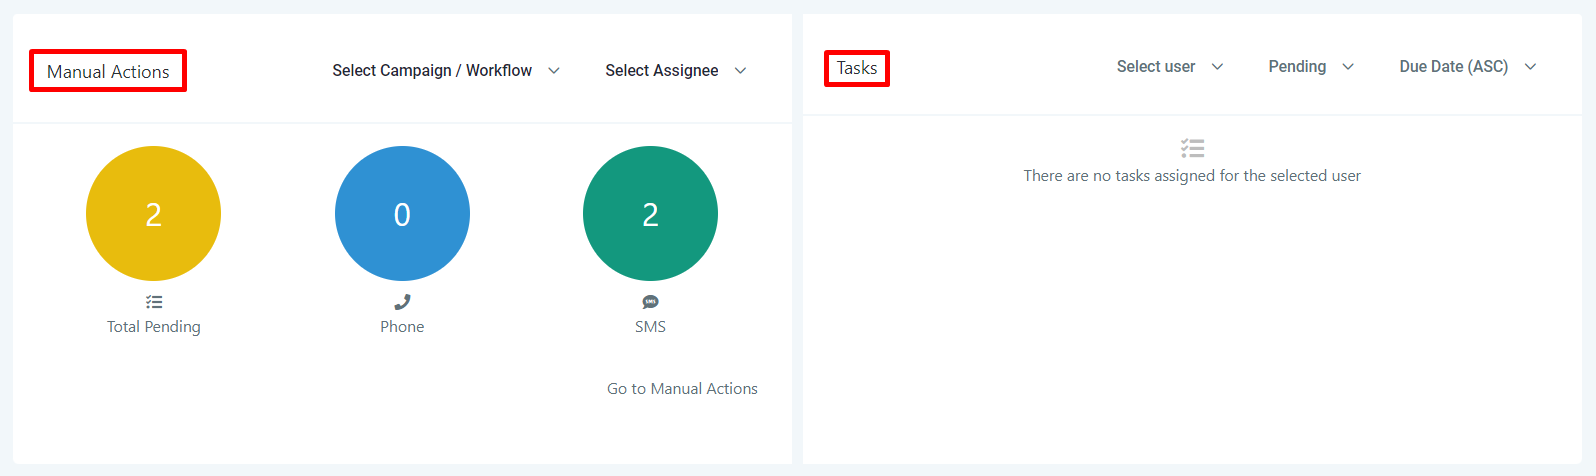
Row 3:
- Manual Actions: An overview of manual actions
- Tasks: A list of assigned tasks for one or all users within your account.
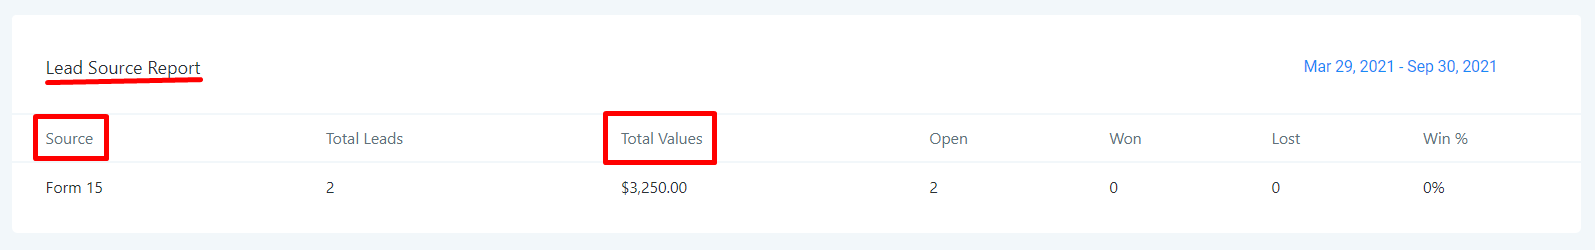
Row 4:
- Lead Source Report: This is the section where you can review the origin and value of your leads.
Keep learning