
The Shopify Elements integrated within GoHighLevel
Navigate to the Automation tab, select Workflow, and then click the option to create a new Workflow. Within the Workflow…


Handling client dashboard issues in whitelabel environments can feel like navigating a maze. Dashboards are the control centers for business operations, making it quite a headache when they falter. Clients often express concern when they hit roadblocks like slow loading times or confusing interfaces. It’s essential to get these sorted quickly to keep things running […]

This messaging policy is applicable to all subaccounts utilizing LC – Phone for communication within the CRM platform. Everyone expects the messages they want to receive to arrive without interference from filters or other barriers. A key way LC – Phone and its users can help ensure that outcome is by actively preventing and removing […]
HighLevel is dedicated to helping you stay compliant with messaging regulations, including A2P 10DLC standards in the U.S. To support this, we’ve enhanced our SMS compliance settings for sender ID and opt-out messaging. These improvements ensure that the initial message in any conversation—such as Missed Call Text-Back (MCTB) or review requests—automatically includes sender identification and […]
What is a Regulatory Bundle? Telecom carriers in certain countries require Regulatory Bundles to confirm the identity and location of individuals or businesses acquiring phone numbers. These bundles typically include documents like a government-issued ID, utility bills, or business registration information, ensuring compliance with local laws on number ownership. Phone numbers in regulated regions cannot […]
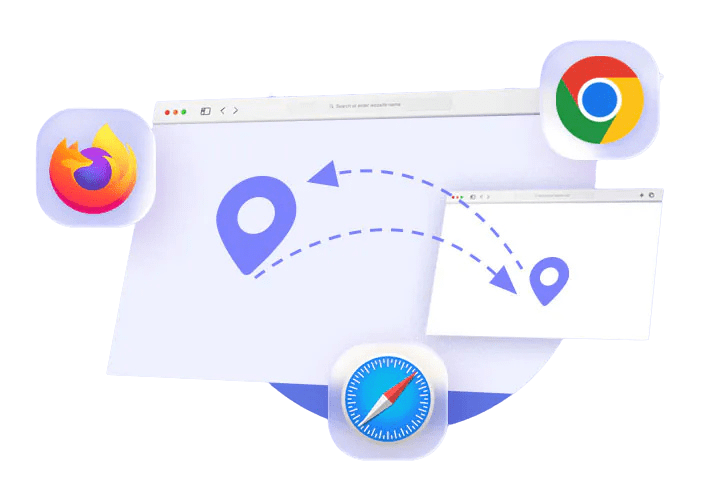
Safari on MacOS Chrome on MacOS Coming Soon Chrome on Windows Coming Soon Firefox on Windows Coming Soon Microsoft Edge on Windows Coming Soon
We’ve made major improvements to our platform’s loading functionality. Instead of the classic 9-dot loader, we’ve introduced a sleek, modern spinner. This updated design features distinct visual states to clearly represent processes such as app initialization, data retrieval, and user detail loading. What Statuses to expect when the HighLevel is loading? Initializing the App: This […]
Error: No connected account.
Please go to the YouTube Feeds settings page to connect an account.

Navigate to the Automation tab, select Workflow, and then click the option to create a new Workflow. Within the Workflow dashboard, opt for starting a new Workflow from Scratch. Click Add New Workflow Trigger Scroll down until you see Shopify, and add the three tabs under Shopify. After adding the desired components, proceed to click […]

Go High Level and ClickFunnels are both popular platforms for building and managing online marketing campaigns. Go High Level is a comprehensive platform that offers a range of features, including lead generation, appointment scheduling, and customer relationship management. ClickFunnels, on the other hand, is focused on creating high-converting sales funnels and landing pages. Both platforms […]
I caught up with the one and only Shaun Clark of HighLevel (GoHighLevel) to talk through his experience with this years Summit called LevelUp summit, which was held in Dallas, Texas in October. He shares some inside information into the team, what’s around the corner for Q1 next year and of course some of the […]
What is GoHighLevel? Gohighlevel promises to be the perfect solution for small business owners, agency owners and even anyone really looking to start a marketing agency from home, and entrepreneurs who want an all-in-one sales, SMMA and marketing automation platform. In this review, we’ll take a look at how Gohighlevel can help you grow your […]
I’ve been waiting a long time for this one. Finally the GoHighLevel team announced their reporting and analytics for subaccounts. Next time you navigate to your agency dashboard, click sub-accounts and you’ll see a lovely list of sub-accounts along with all their metrics. Its looks obvious to me that they only starting ingesting the data […]
Getting clients started on the right foot is key to avoiding confusion and ensuring satisfaction in the long run. Having a well-structured onboarding checklist can make this process much smoother. It’s like having a roadmap for a journey—if you know where you’re headed and have planned stops along the way, there’s less chance of getting […]